
Executive summary
- Global risk assets witnessed a significant selloff in early August 2024.
- The Bank of Japan (BoJ)’s rate hike, unwinding of Yen-funded carry trades, and rising US recession concerns, triggered the downside.
- Historical patterns suggest that markets typically overextend both on the upswing, and during the declines.
- Key global equity indices have had a good run year-to-date, and as such were susceptible to profit-taking at the slightest hint of trouble.
- We need to see the Yen carry trade unwinding fully run its course and for the CBOE VIX volatility index to fall back toward the more normal 20-plus range, before more rational behaviour returns.
- Investors need to assess ongoing developments, as well as forward-looking data points objectively as they unfold, and not overreact.
Global risk assets see huge selloff – what were the triggers?
Over the few trading days from August 1 to 5, global risk assets saw a heavy selloff with major global equity indices down double digits, in percentage terms (see chart 1).
Chart 1: Equity index performance (month-to-date to August 5, in common USD terms)
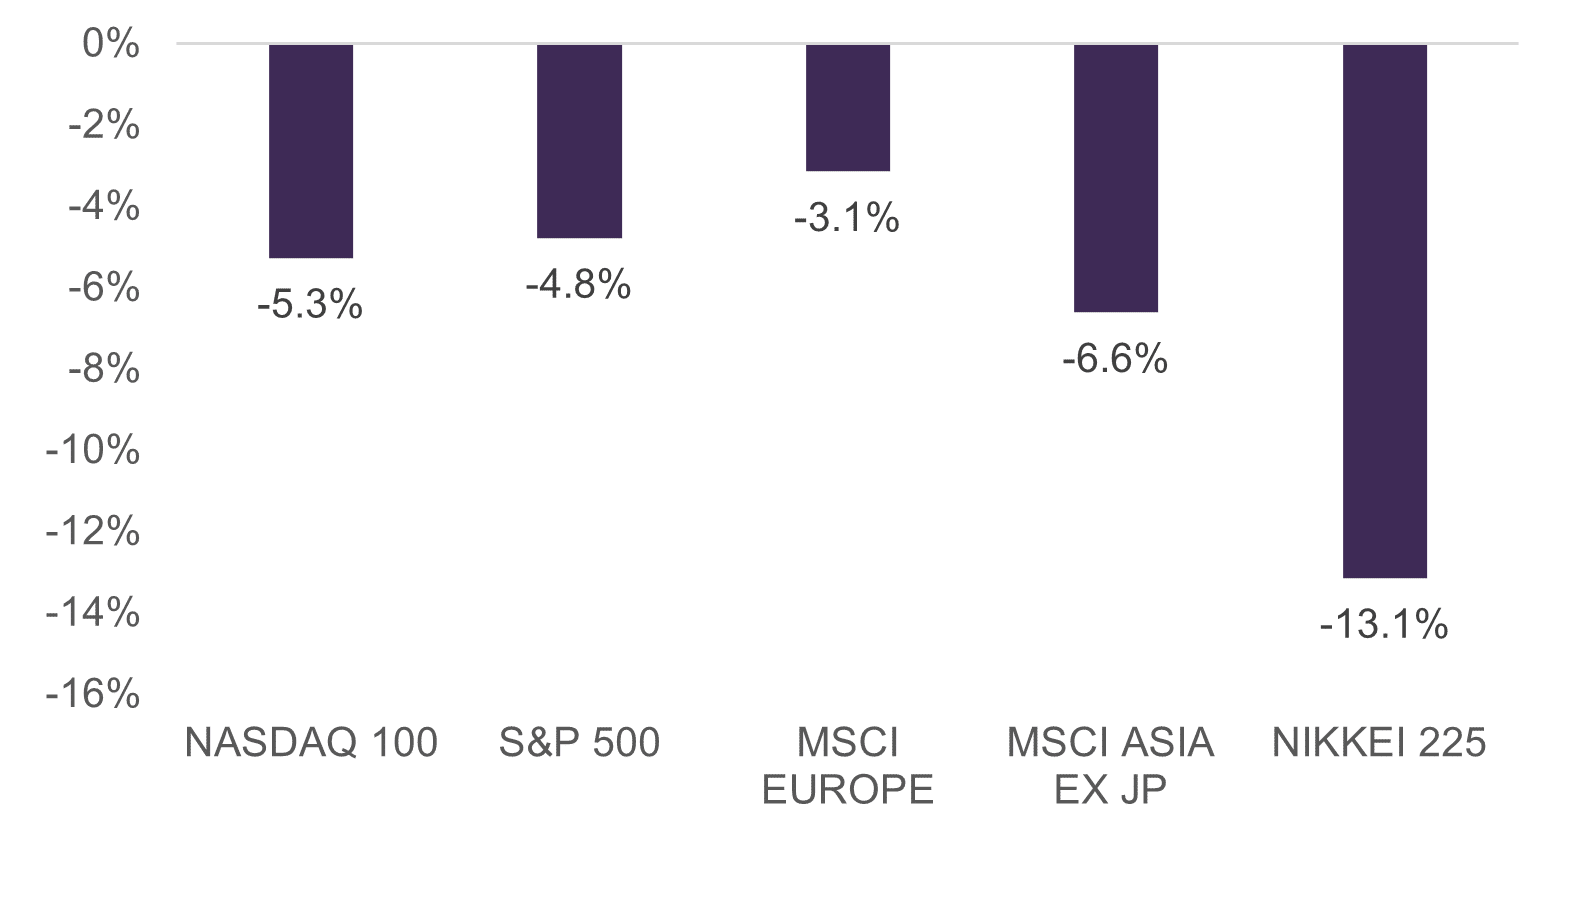
Source: LSEG Datastream, August 2024. Returns calculated in USD.
The declines may seem steep, but bear in mind this is the second year running of very strong returns, with markets maintaining momentum year to date prior to the selloff (see chart 2). After such large gains, it is not unusual for markets to be more susceptible than usual to the slightest hints of trouble, and move quickly to take profits. Developments that sparked this risk-off trade included a confluence of factors: from the Bank of Japan’s hawkish policy pivot – prompting a sharp spike in the Yen and the unwinding of long-established carry trades funded by the currency, softer forward guidance by corporates, a weaker than expected US July non-farm payrolls and higher unemployment. This led to the perfect storm with investors engaging in a “sell first and ask questions later” type of behaviour.
Chart 2: Selected market index performance in USD terms (year-to-date to August 5 2024)
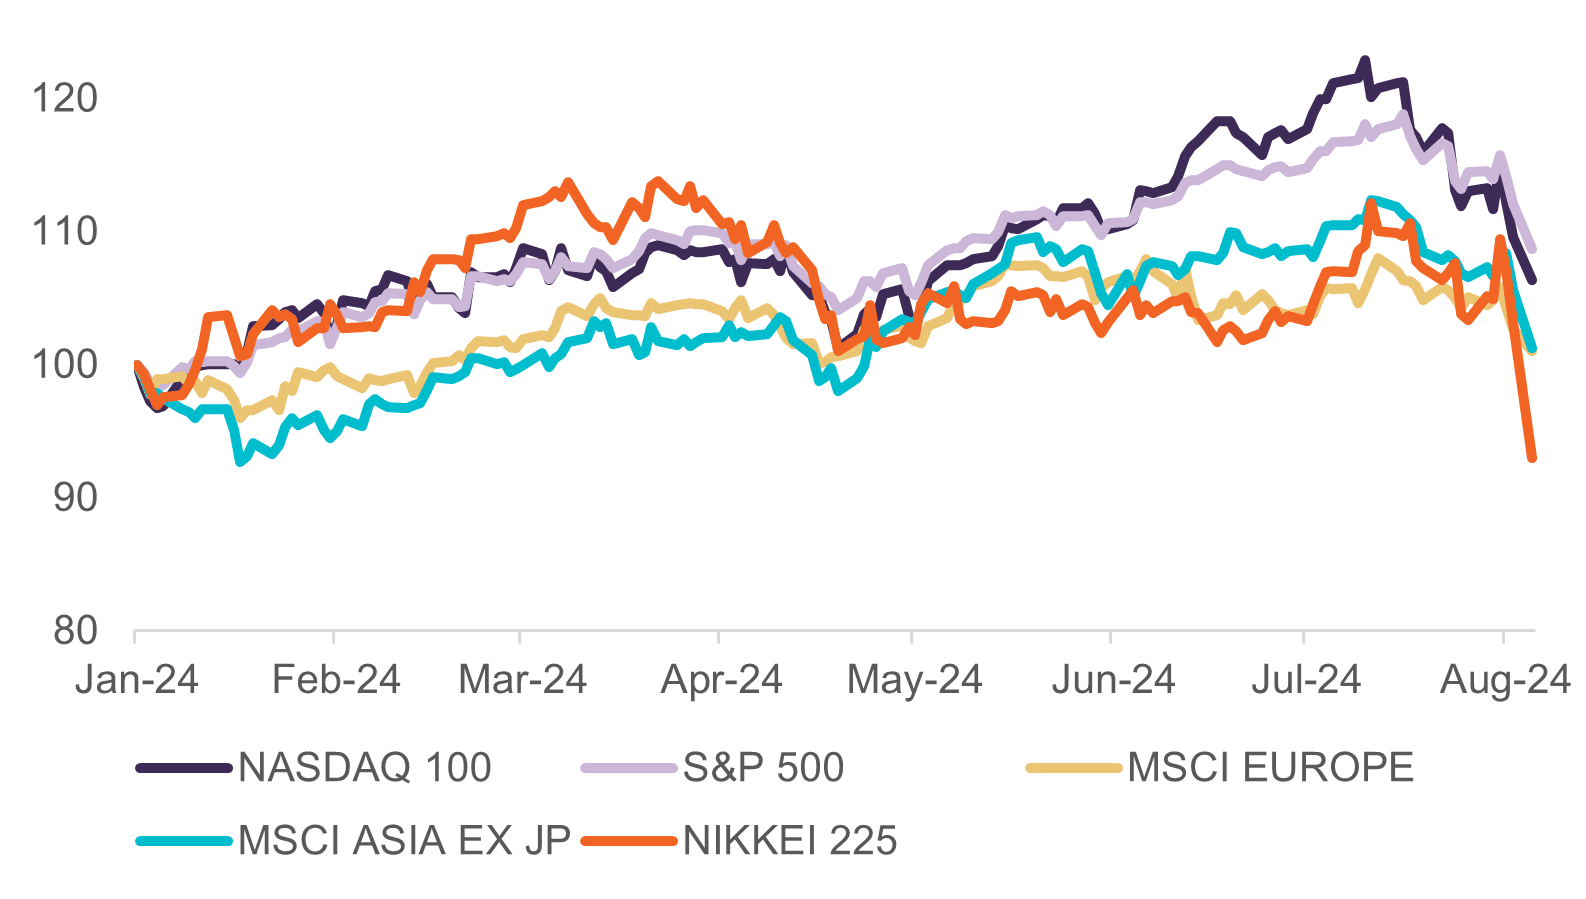
Source: LSEG Datastream, August 2024. Returns calculated in USD.
What should we make of the selloff – is it fundamentally-led or sentiment-driven?
The narrative dominating investors’ minds now are concerns over a US recession. Examining this further, we know that market perception and risk appetite can change abruptly. Not too long ago, the notion on the street was that the US economy was on a firm footing, earnings growth was steady, and US employment, as well as US household balance sheets were in a strong position. Additionally, the view was that the positive prospects and productivity-led gains from AI still had a long structural growth runway ahead. So, the key question to ask is: Have all these assumptions changed, or can fundamental factors underpinning such longer-term structural growth trends collapse overnight?
While not downplaying the magnitude of this selloff (these have been some of the steepest declines in over two years), we can observe from history that market action typically overreacts – both on the upside as well as on the downside – especially in the absence of reliable forward-looking information on activity to come. The year-to-date behaviour of risk assets could well fit into this pattern, where markets were bullish on the upside and now overreacting on the way down. In some sense the correction, while steep and painful, may ultimately prove to be a healthy development as it helps put some sensibility checks and assessments back into market valuations and assumptions.
Implications from here
Markets may still be volatile in the short-term as it may take a while for the unwinding of Yen-funded carry trades to fully run its course. Certain quarters are also calling for an intra-meeting emergency Fed rate cut, but this would depend, in part, on the Fed believing there is deflation stress with this shock to cause US unemployment to rise significantly. How global policymakers act to calm market nerves and restore confidence would also be critical. Notwithstanding these developments, there are also increased concerns surrounding rising Hezbollah-Israel and Iran-Israel tensions, to add to the mix.
Sentiment, rather than fundamentally-led factors appear to be playing a larger role in influencing the market action at this point. It may take some time before confidence and more rationale behaviour returns. A key signpost to watch would be for the VIX levels to fall back from the c. 39 level readings now [see chart 3]1. Meanwhile, it would be prudent to pay attention to ongoing developments, assess the root causes behind the market actions as forward-looking data comes to the fore, and ascertain whether these are valid or otherwise. It is important not to overreact.
Chart 3: CBOE VIX volatility index (year-to-date to August 6 2024)
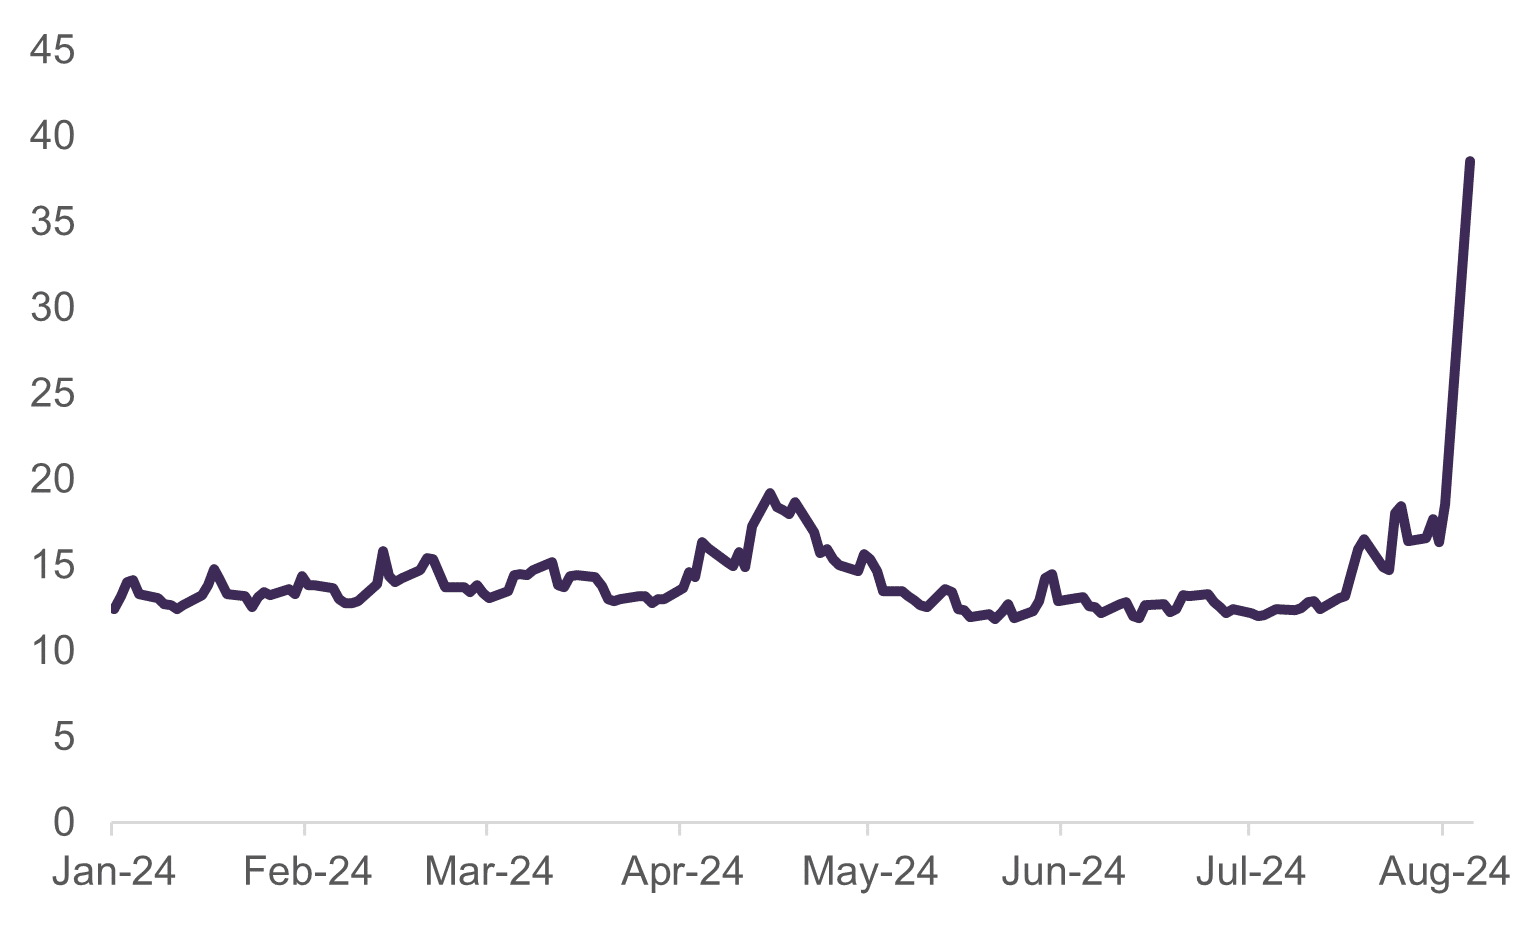
Source: LSEG Datastream, August 2024.
1 VIX (a measure of expected volatility for the S&P 500 over the coming 30 days) peaked at 82 with the sell-off when COVID hit in Q1 2020. A key level to fall back toward would be the 30-40 range, before eventually returning toward a more normal 20 (the average of the last 10 years). Global equity markets remain very volatile. For example, Japanese stocks jumped at the open (on August 6), underpinning a recovery across battered Asian share markets. The Nikkei 225 soared more than 10%, rebounding sharply from its worst sell-off since the 1987 Black Monday crash in the previous session (slumping 12.4% on August 5).
Important Information
No offer or invitation is considered to be made if such offer is not authorised or permitted. This is not the basis for any contract to deal in any security or instrument, or for Fullerton Fund Management Company Ltd (UEN: 200312672W) (“Fullerton”) or its affiliates to enter into or arrange any type of transaction. Any investments made are not obligations of, deposits in, or guaranteed by Fullerton. The contents herein may be amended without notice. Fullerton, its affiliates and their directors and employees, do not accept any liability from the use of this publication. The information contained herein has been obtained from sources believed to be reliable but has not been independently verified, although Fullerton Fund Management Company Ltd. (UEN: 200312672W) (“Fullerton”) believes it to be fair and not misleading. Such information is solely indicative and may be subject to modification from time to time.
The audio(s) have been generated by an AI app