
Author:
Robert St Clair
Head of Investment Strategy, Fullerton Fund Management
3 September 2024
Fullerton’s “3i’s” investment theme underpins our bullish outlook for global risk assets, focusing on Industry 5.0, Innovation and Involution - key drivers posed to significantly boost overall corporate performance over time.
1. Industry 5.0
Industry 5.0 is the next evolutionary phase in the trajectory of industrial development. While new technologies such as AI and related technologies may take some time to reach the peak of their utilisation and impact, we believe that when the technological advancements and scale reach a tipping point at about 2030, the transformation anticipated with Industry 5.0 carries with it the potential not only to redefine productivity and efficiency but to spur the creation of innovative products and services.
The waves of industrial revolution
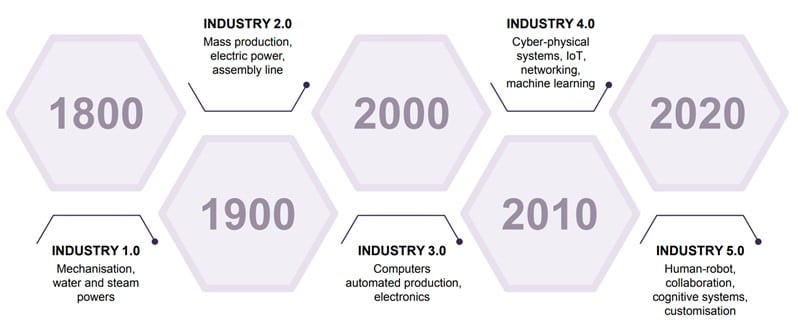
Source: Bank of America, "Me, Myself and AI", February 2023
What new-tech can create:
Higher revenues + cost savings = greater earnings
For example, corporate revenue can rise over time because infotech can drive a more rapid transmission of ideas, enhance e-commerce, and facilitate the production of higher-value added goods and services for consumers. Significant cost savings can be created as infotech increases automation and efficiencies. In turn, higher productivity can reduce raw material demands, costs of production, and better align wages to workers’ value creation.
2. Innovation
Our second ‘i’ – Innovation, speaks to the breakthroughs initially sparked by Industry 4.0 - automation, cloud computing, machine learning and IoT. These technologies are set to receive a further boost from Industry 5.0, especially across tech-savvy nations such as the US, Japan, and Germany, which have in recent years seen substantial benefits in terms of enhanced productivity, cost efficiency, and higher than otherwise earnings.
3. Involution (i.e. the Great Decoupling of China)
The last of our thematic 3i’s is ‘involution’, which reflects China’s longer-term headwinds as it searches for policy solutions to end weakness across the real-estate sector, resolve economy-wide deflation pressures, and boost corporate performance. With a trend decline in potential GDP growth, policymakers’ strategy has been to channel rising per capita incomes to try and boost the domestic economy with stronger consumption. But such rebalancing is proving a slow process.
What this means is that while China equities may not transform into a robust ‘trending market’ until its long-term headwinds are resolved, it can still offer cyclical alpha. For example, as we have seen over the last few years, growth stocks have struggled but value stocks have outperformed.
How 3i’s are collectively driving the ‘Great Decoupling’ since 2023
Key global equities
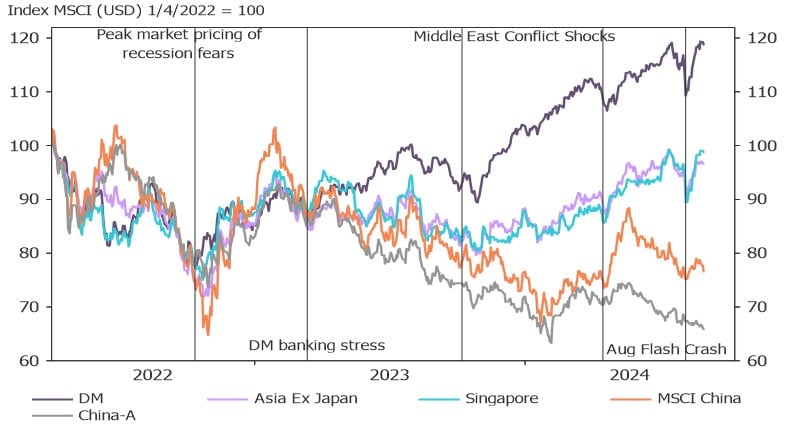
Source: LSEG Datastream, 29 August 2024
US equity market performance is broadening
The performance of the US equity market is showing an encouraging expansion, with an especially positive note being the sustained strength in earnings growth expectations. Since the end of the very positive Q2 (June) earnings season, S&P500 earnings growth expectations have crept higher, with the largest increases being across healthcare, materials and real estate. The Q2 reporting season showed that 80% of all US firms are still beating market expectations1, which further underpins the depth of robust market fundamentals. With all sectors having a large majority of firms beating expectations, this broadening of performance bolsters our bullish stance on developed market equities, particularly those within the US.
US S&P500 earnings growth expectations
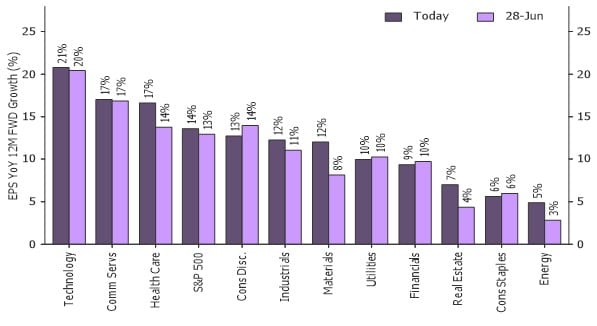
Source: LSEG Datastream, 29 August 2024
Percentage of US S&P firms beating earnings expectations
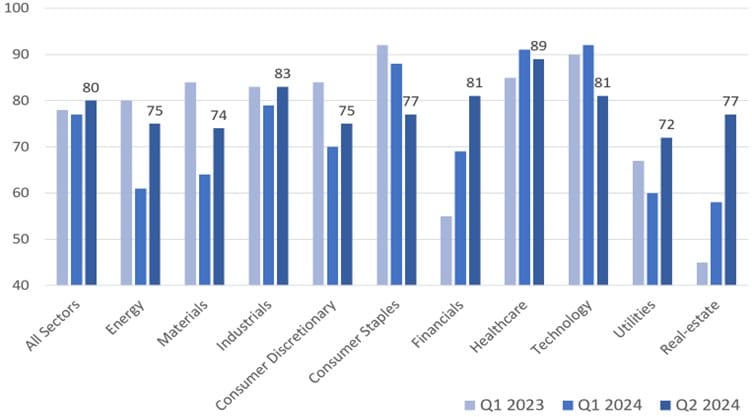
Source: LSEG Datastream, 29 August 2024
Despite the inevitable slowdown in US growth from last year (where 2H23 growth was surging at 4.2%) with the Q124 slump (to 1.4%), growth has rebounded to a more sustainable 2-2.5% range2. Against this backdrop, we remain steadfast in our belief that the twin pillars of robust productivity and controlled labour costs will continue to underpin equity returns. Domestic consumption in the US is expected to remain strong, fuelled by healthy household finances enriched by the recent wealth boom. Looking from the supply side, the stronger US corporate investment should help enhance labour productivity gains over time.
Equity returns across key markets (YTD)
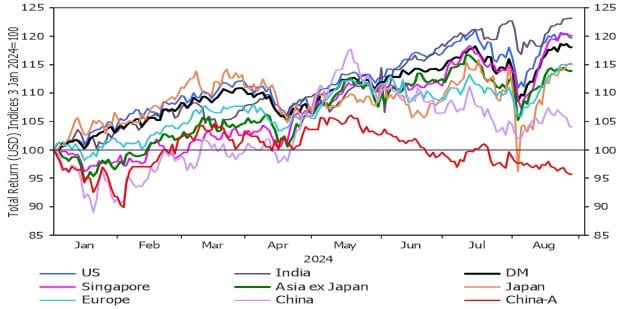
Source: LSEG Datastream, 29 August 2024
There are investor concerns of a potential bubble within the tech sector, sparked by what appears to be overwhelming exuberance towards the ‘magnificent-seven’ counters. Nevertheless, strong performance of the US tech sector is not new; the post-2010 landscape has evolved distinctly from the 1990s narrative.
Since the turn of the last decade, we've witnessed the earnings and returns of the US IT sector not just resonate with each other but also consistently eclipse the broader market performance (see below). With the August ‘flash crash’ sparking a dramatic sell-off, IT sector equity prices have fallen significantly. But they have not undershot their trend outperformance of the market. We believe that as IT earnings and return trends can remain synchronised over time it can potentially help reduce the risk of a bubble forming.
US IT sector performance (Nasdaq 100) vs. US equity market (S&P 500)
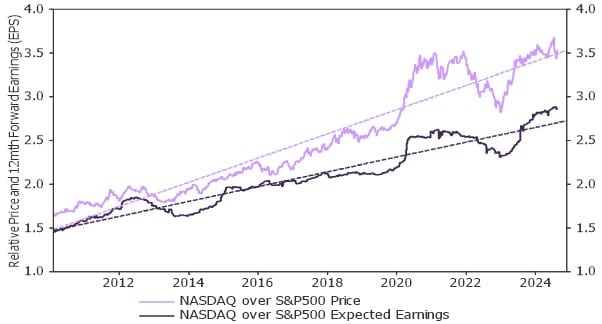
Source: LSEG Datastream, 29 August 2024
The resilience of the US equity market is further accentuated by the very high corporate profit levels and some degree of deleveraging post the COVID-induced recession, which has resulted in an increase in interest income from cash reserves. Consequently, net interest payments (as a share of earnings) by US corporations are touching record lows. This dynamic, among others, explains why the elevated interest rates haven't exerted excessive strain on US equity market performance.
Added to this, as we look towards next year, the prospect of improved liquidity conditions, as the Fed progresses through its likely rate cuts, should give an extra boost to sentiment among investors.
Find out more about Fullerton Lux Funds - Global Absolute Alpha
Important information
No offer or invitation is considered to be made if such offer is not authorised or permitted. This is not the basis for any contract to deal in any security or instrument, or for Fullerton Fund Management Company Ltd (UEN: 200312672W) (“Fullerton”) or its affiliates to enter into or arrange any type of transaction. Any investments made are not obligations of, deposits in, or guaranteed by Fullerton. The contents herein may be amended without notice. Fullerton, its affiliates and their directors and employees, do not accept any liability from the use of this publication.
information contained herein has been obtained from sources believed to be reliable but has not been independently verified, although Fullerton believes it to be fair and not misleading. Such information is solely indicative and may be subject to modification from time to time.
Neither MSCI nor any other party involved in or related to compiling, computing or creating the MSCI data makes any express or implied warranties or representations with respect to such data (or the results to be obtained by the use thereof), and all such parties hereby expressly disclaim all warranties of originality, accuracy, completeness, merchantability or fitness for a particular purpose with respect to any of such data. Without limiting any of the foregoing, in no event shall MSCI, any of its affiliates or any third party involved in or related to compiling, computing or creating the data have any liability for any direct, indirect, special, punitive, consequential or any other damages (including lost profits) even if notified of the possibility of such damages. No further distribution or dissemination of the MSCI data is permitted without MSCI's express written consent.
Report issued: August 2024
